New authoritarianism
Új tekintélyelvűség - projekt
In September of 2010 we carried out a survey on a national representative sample1 on the problems of the new and old authoritarianism. The research was supported by the Social Conflicts Research Center (Társadalmi Konfliktusok Kutatóközpont) of the Eötvös Loránd University.2> Our aim was to understand the process resulting in growing prejudices and chauvinism in Europe generally and in Hungary particularly.
Based on the data received from the European Social Survey, the Political Capital Institute has reached the conclusion that there is a peculiarly high number of people in Hungary who show intolerance towards social minorities (immigrants, homosexuals etc.). Based on the DEREX index developed by the Institute the distribution of prejudice and chauvinism in Europe can be demonstrated on Map 1.
Map 1. The proportion of individuals supporting prejudice and welfare chauvinism in Europe (2008)
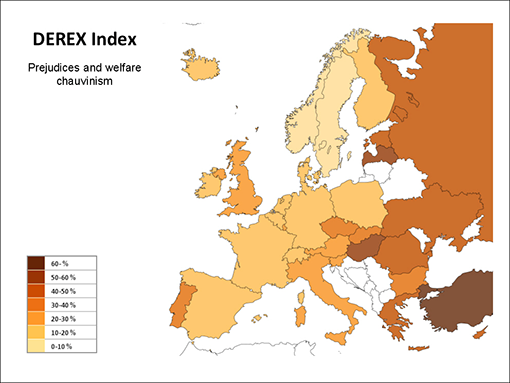
Source: Political Capital Policy Research & Consulting Institute3
Based on the data included in this map as well as on the data stemming from our previous research, (Csepeli, Prazsák 2010) and the everyday experience it became obvious that we need to examine these phenomena more attentively, at least in Hungary. This is why we started our survey research. Below we present the patterns of beliefs on human life and existence based on the answers given to the first set of questions in our questionnaire. Following this block taken together the individual belief patterns we will present the results of multivariate analysis that will hopefully reveal the psychological and sociological determinants of the new authoritarianism.
The idea of social dominance
The cognitive element which structurally determines new authoritarianism is the attitude towards the idea, that all groups of people have equal rights, which can be measured using the Social Dominance Orientation Scale, developed by Sidanius and Pratto (2001).
Based on results of pretests we modified the scale. We preserved only the items which elicited no refusal and posed no grounds for stylistic objections or problems of understanding.
Finally, we decided to include 11 items into the questionnaire. The respondents were to express their agreement or disagreement.
Table 1. The items used to measure attitudes towards social dominance
|
|
In the case of the first six items agreement indicates a positive attitude towards social dominance, while if the answer is no, the respondent does not show this attitude. In the case of the next five items we have an opposite situation: if one agrees, one would like to live in a society, where people are equal.
In the case of every item the respondents had to express the degree of her/his agreement or disagreement on a 5 point Likert scale.4 The average scores are presented in Table 2.
Table 2. The average scores of agreement-disagreement with items concerning social dominance5
|
|
Average |
Std. deviation |
|
All groups should be given equal chance in life. |
4.4 |
0.9 |
|
No group should dominate in society. |
3.9 |
1.14 |
|
It would be good if groups could be equal. |
3.8 |
1.14 |
|
We would have fewer problems if we treated people more equally. |
3.8 |
1.16 |
|
We should strive to make incomes as equal as possible. |
3.7 |
1.13 |
|
Sometimes other groups must be kept in their place. |
3 |
1.25 |
|
In getting what you want, it is sometimes necessary to use force against other groups. |
2.6 |
1.35 |
|
To get ahead in life, it is sometimes necessary to step on other groups. |
2.5 |
1.32 |
|
Some groups of people are simply inferior to other groups. |
2.3 |
1.38 |
|
It is probably a good thing that certain groups are at the top and other groups are at the bottom. |
2.2 |
1.28 |
|
It’s OK if some people have more of a chance in life than others. |
2.1 |
1.27 |
We can see in Table 2. that the most refused item (2.1) was the one stating that “It’s OK if some people have more of a chance in life than others”. Most people agreed with the statement: “All groups should be given equal chance in life.”
All in all we can say that the whole of the sample could be characterized in the following way: regarding the items referring to the acceptance of social dominance one can observe general disagreement, while regarding the items referring to the refusal of social dominance, one can observe general agreement. Moreover one can see that in the case of the items referring to the acceptance of social dominance, the standard deviation is much higher, which refers to the fact that people in Hungary are much more divided when they have to decide whether they accept or refuse the idea of social dominance formulated in the affirmative way as opposed with the case of items which express the refusal of the idea of social dominance. Looking at the averages, it becomes obvious that in contemporary Hungarian society the most important value is social equality. This result is in correspondence with the results of the international comparative research conducted in the first decade of the 21th century (Lelkes 2009).
Averages however, do not say anything about the existence of cognitive patterns which determine the attitude towards social dominance measured by the whole of the scale. These patterns can be revealed by means of principal component analysis. According to the results of principal component analysis the attitude towards social dominance differed as a function of the formulation of the items. As a result of the analysis two principal components emerged. In the first principal component those items were found which expressed the creed of human equality. In the second principal component we found those items which legitimized social inequality.
These emergence of two cognitive patterns cannot taken for granted at all. Based on the results of several international survey research, not matter the sample was big or small, Sidanius and Pratto reached the conclusion that the items can be placed on basically one dimension, in case they conducted a factor analysis. Still, based on their report, in two cases these answers could be placed on not one, but two dimensions6, measuring two somewhat different phenomena. Nevertheless in the case of both samples they found a strong correlation between the primary components (r = 0.6), that is why they formulated the following conclusion: “though this issue may bear further exploration, at present we have no research evidence that it would be useful to consider the two subdimensions of SDO as independent” (Sidanius, Pratto 2001: 71).
Nevertheless, in our sample we could identify two dimensions, not completely independent, but in a much weaker connection with one another (r = 0.2).7 Based on our further analyses we tried to make it unambiguous that the two dimensions are organized around the acceptance of equality or inequality of the different social groups, and differ in their contents as well.
First let us examine the two answer patterns, the two principal components, presented in Tables 3 and 4.
Table 3. Principal component of ethnic social dominance orientation
|
|
Communality |
Factor loading |
|
Some groups of people are simply inferior to other groups. |
0.49 |
0.7 |
|
In getting what you want, it is sometimes necessary to use force against other groups. |
0.53 |
0.73 |
|
It’s OK if some people have more of a chance in life than others. |
0.6 |
0.77 |
|
To get ahead in life, it is sometimes necessary to step on other groups. |
0.6 |
0.77 |
|
It is probably a good thing that certain groups are at the top and other groups are at the bottom. |
0.59 |
0.77 |
Explained variance: 56.11 %
Table 4. Principal component of class based social dominance orientation
|
|
Communality |
Factor loading |
|
It would be good if groups could be equal.. |
0.65 |
0.81 |
|
All groups should be given equal chance in life. |
0.4 |
0.63 |
|
We would have fewer problems if we treated people more equally. |
0.66 |
0.81 |
|
We should strive to make incomes as equal as possible. |
0.56 |
0.75 |
|
No groups should dominate in society. |
0.43 |
0.65 |
Explained variance: 53.88 %
The content of the two principal components can interpreted by logic. Accordingly there is a cognitive pattern which perpetuates the idea of social equality and inequality around the legitimacy of inequality. Based on this pattern some accept, while others dismiss the legitimacy of social inequality. The other cognitive pattern is based on a different logic. In the case of this one the central idea is not inequality but equality. Based on this pattern some opt for social equality, or they refuse it.8
If we want to perform not a logical but a content-based analysis of the two principal components, we need to start with the most stressful item of the set legitimizing social inequality, which is as follows: “Some groups of people are simply inferior to other groups.” This argument is the key element of the ethnic mindset, according to which belonging to a group is determined at conception, and it cannot be changed, and this determines the place of the person within social hierarchy. We can conclude that this primary component can be identified as a bearer of ethnic social dominance orientation (E-SDO).
As opposed to this the other principal component identifies as a central element of the modern organization of society the equality of chances (Gellner 1983). The idea of the equality of chances, of income, of the lack of domination assumes that the person approaches the question of social equality and inequality based on class. Consequently this principal component can be placed to the dimension of class social dominance orientation (C-SDO).
If we wish to see the distribution of the respondents based on whether they accept or refuse the ethnic or class social dominance, it is helpful to make an analysis during which we differentiate the respondents who do not accept any form of social inequality, either ethnic or class based. There is a different group, members of which accepts inequality, but not based on class. The third case is when some do not accept inequality based on ethnic criteria, but accept inequality based on class. And there are some, who consider the inequality between people legitimate, either based on ethnicity, or based on class. In order to separate these groups, we conducted a K-means clustering on the E-SDO and C-SDO principal components, and the results, the stable cluster centers are presented in the following table.
Table 5. The acceptance and rejection of social and class dominance orientation9
|
|
Refusal of both types of inequality |
Acceptance of both types of inequality |
Accept class based inequality, refuse ethnicity based inequality |
Accept ethnicity based inequality, refuse class based inequality |
|
E-SDO (pc) |
-0.81 |
0.82 |
-0.64 |
1.06 |
|
C-SDO (pc) |
-0.78 |
1 |
1.19 |
-0.29 |
|
N (%) |
379 (38 %) |
193 (19%) |
163 (16%) |
249 (25%) |
Based on the last row of Table 5 we can conclude that the majority of the Hungarian society accepts some kind of inequality between people. We can see that the ones refusing any kind of inequality are only a minority (38%).
External and internal control
The classical analyses of authoritarianism have not dealt with directly whether the person considered himself or herself an anvil or a hammer in the smithy of fate, but it seems not to be a premature conclusion to say that authoritarianism can be considered as a state of the lack of autonomy, in which the person perceives himself or herself as a prisoner of external factors (Kroeger 2007:104).
We included four questions in our questionnaire regarding the level to which the person – considering the course of his or her life – interprets his/her life as a function of internal or external control patterns (Rotter 1990).
The first question referred to the putative reasons of the career. One of the alternatives determined the career as a function of luck, the other alternative determined the career as a function of ability. The second question included two possible answers regarding the factors determining the course of life. One of the alternatives stated that the course of life “depends on unknown forces”, ones that cannot be influenced by people, while the other alternative stated that the course of life can be influenced if “we take part in the political and social life”. The third question aimed to uncover the theories referring to the connection between life and chance. One of the possible answers stated: “life can be influenced by chance, but it is unknown to most people”, while the other answer said: “there are no such accidental things.” The fourth question referred to whether the respondent thought that he or she could influence the events determining his or her life.
Table 6. The distribution of variables measuring external and internal control(%)
|
|
External control |
Internal control |
Does not know/no answer |
Total |
|
In order for someone to have a proper career… |
48 |
44 |
8 |
100 |
|
The things that influence life… |
38 |
49 |
13 |
100 |
|
The chances which have an influence on life… |
58 |
33 |
9 |
100 |
|
The events determining my life… |
49 |
45 |
6 |
100 |
As one can see, the respondents form two distinct groups based on the questions referring to external and internal control. The answers given to the questions are not independent. Multivariate analysis10 resulted in one variable, the high level of which refers to the acceptance of internal control, and the refusal of external control, while the low level of which refers to the refusal of internal control and the acceptance of external control. The result of this analysis is included in Table 7.
Table 7. External control – internal control main component
|
|
Discrimination value |
Centroid Coordinates |
|
|
External control |
Internal control |
||
|
In order for someone to have a proper career… |
0.39 |
-0.63 |
0.67 |
|
The things that influence life… |
0.57 |
-0,91 |
0.71 |
|
The chances which have an influence on life… |
0.31 |
-0.43 |
0.77 |
|
The events determining my life… |
0.58 |
-0.75 |
0.82 |
|
The eigenvalue of the dimension: 1.84 (46 %) |
|||
The decay of Hungary
With the help of an 18 items we tried to examine what people think about the causes of the state that things in Hungary are not going too well. In the case of every item respondents had three possibilities. If they considered the given cause as very effective, they gave 3, if they considered the given cause just effective, they gave 2, and if they thought that the cause concerned was not effective at all, they gave 1.
Table 8. Attributions of the deterioration of the country (averages)
|
Politicians are looking for their own benefits solely. |
2.62 |
|
Parties cannot get to a consensus. |
2.59 |
|
Everyone wants to be rich at once, people don’t care with the future. |
2.53 |
|
Contraselection of persons in leading positions. |
2.48 |
|
Only those politicians can win who promise a lot. |
2.44 |
|
Too many companies are owned by foreigners. |
2.41 |
|
Tax evasion is rampant. |
2.41 |
|
Too many lazy persons are living in the country. |
2.39 |
|
There was no real change of the system. |
2.27 |
|
We are directed by the EU, we are not independent. |
2.25 |
|
We are no taking over the best solutions from abroad. |
2.13 |
|
Our country is exploited by Jewish capitalists. |
2.07 |
|
We are not thrifty enough. |
2.06 |
|
The political and the economic power is in the hands of former Communists. |
2.05 |
|
The number of the well rained workers is too low in the country. |
2.03 |
|
Public safety is in danger because of the Gypsies. |
2.02 |
|
Few speak foreign languages in the country. |
1.96 |
|
Few people are able to take risks. |
1.93 |
Based on the averages one can conclude that all in all the respondents of the national representative sample blame politicians, foreigners, cheaters, Jews and Gypsies, and the idea according to which the Hungarians themselves play a part in all of these is not very popular. The multivariate analysis of the attributive judgments shows that there are three typical patterns of causes, which determine the way people think about the causes of problems in Hungary.
Table 9. Principal component of the ”anomic profit making”
|
Communality |
Factor loading |
|
|
Parties cannot get to a consensus. |
0.43 |
0.66 |
|
Politicians are looking for their own benefits solely. |
0.47 |
0.69 |
|
Contraselection of persons in leading positions. |
0.45 |
0.67 |
|
Too many lazy persons are living in the country. |
0.29 |
0.54 |
|
Only those politicians can win who promise a lot. |
0.3 |
0.55 |
|
Everyone wants to be rich at once, people don’t care with the future. |
0.44 |
0.67 |
|
Tax evasion is rampant. |
0.26 |
0.51 |
|
Too many companies are owned by foreigners. |
0.36 |
0.6 |
|
Explained variance: 37,49 % |
||
The pattern of anomic profit making is based on an idea of unjust society, which on the one hand condemns people who are high in society, but on the other it condemns the ones who are low. This image of society presents a covert prerequisite, that scrounging is preferred to common good. The belief in anomic profit making in the empirical sense is a principal component, the high values of which indicate the attributive role of anomie, while the low values indicate the lack of this role.
The organization of the second attributive pattern is based on the idea of new colonialism.
Table 10. Principal component of the ”new colonialism”
|
Communality |
Factor loading |
|
|
We are directed by the EU, we are not independent. |
0.41 |
0.64 |
|
Our country is exploited by Jewish capitalists. |
0.53 |
0.73 |
|
Public safety is in danger because of the Gypsies. |
0.31 |
0.56 |
|
There was no real change of the system. |
0.54 |
0.73 |
|
The political and the economic power is in the hands of former Communists. |
0.56 |
0.75 |
|
Explained variance: 46.86 % |
||
The disapproval of the EU includes blaming communists, Jews and Gypsies for the failure of the system change. The high values in the principal component of new colonialism refer to the tendency to blame the EU, the Gypsies, the Jews, the communists, while a low value indicates the lack of this tendency.
The third attribution pattern is based on a different logic. In this pattern we find the internal cause of collective self-criticism, which explain the deterioration of Hungary referring to internal and not external factors.
Table 11. The principal component of “self-criticism”
|
Communality |
Factor loading |
|
|
We are no taking over the best solutions from abroad. |
0.36 |
0.6 |
|
We are not thrifty enough. |
0.4 |
0.64 |
|
The number of the well trained workers is too low in the country. |
0.48 |
0.69 |
|
Few speak foreign languages in the country. |
0.45 |
0.67 |
|
Few people are able to take risks. |
0.54 |
0.74 |
|
Explained variance: 44.71 % |
||
A high value of the main component indicates self-critique, while a low value indicates a restraint from self-criticism.
Dogmatism
Rokeach (1960) developed a scale in the 50s of the last century with the help of which he measured the inclination to have an unyielding, expedience-free, “closed” mind, which refuses counter-arguments and critique, and which is inseparable from authoritarianism. The core of this closed mind is anxiety which takes over the inner world of the lonely, defenseless, helpless people. In our questionnaire we included 12 items taken from the original Dogmatism Scale. The respondents were to decide how much they agree with the items. In the case of all items we asked for a response indicated on a 5 degree scale, where 1 meant strong disagreement, while 5 meant strong agreement.
Table 12. The average scores of the questions measuring dogmatism
|
It is only natural for a person to be rather fearful of the future. |
4.00 |
|
There are two kinds of people in this world: those who are for the truth, and those who are against the truth. |
3.44 |
|
It is by returning to our glorious and forgotten past that real social progress can be achieved. |
3.21 |
|
In this complicated world of ours the only way we can know what’s going on is to rely on leaders and experts who can be trusted. |
3.10 |
|
To compromise with our political opponents is dangerous because it usually leads to the betrayal of our own side. |
3.04 |
|
Man on his own is helpless and miserable creature. |
2.74 |
|
Of all the different philosophies which exist in this world there is probably only one which is correct. |
2.63 |
|
It is better to be a dead hero than a live coward. |
2.44 |
|
Fundamentally, the world we live in is a pretty lonesome place. |
2.43 |
|
A man who does not believe in some great cause has not really lived. |
2.23 |
|
While the use of force is wrong by and large, it is sometimes the only way possible to advance a noble ideal. |
2.21 |
|
If I had to choose between happiness and greatness, I'd choose greatness. |
1.94 |
In case of some items indicating dogmatism there is a general agreement among members of the national representative sample. Being afraid of the future can be considered general. The standard deviation of the answers is very low, and that is why this item cannot have a differentiating role. According to the results of the principal component analysis the remaining eleven items have shown three patterns.
The first pattern was named “romantic”, as it has included the fantasies referring to valor and greatness.
Table 13. „Romantic” principal component
|
Communality |
Factor loading |
|
|
A man who does not believe in some great cause has not really lived. |
0.58 |
0.76 |
|
It is better to be a dead hero than a live coward. |
0.47 |
0.68 |
|
If I had to choose between happiness and greatness, I'd choose greatness. |
0.71 |
0.84 |
|
While the use of force is wrong by and large, it is sometimes the only way possible to advance a noble ideal. |
0.58 |
0.76 |
|
Explained variance: 58.54 % |
||
In the second pattern has comprised all the symptoms of the classical “closed mind”, which resists to doubts or contradictions.
Table 14. „Closed mind” principal component
|
Communality |
Factor loading |
|
|
Of all the different philosophies which exist in this world there is probably only one which is correct. |
0.45 |
0.67 |
|
To compromise with our political opponents is dangerous because it usually leads to the betrayal of our own side. |
0.6 |
0.78 |
|
There are two kinds of people in this world: those who are for the truth, and those who are against the truth. |
0.55 |
0.74 |
|
Explained variance: 53.4 % |
||
“Closed mind” offers a comfortable and secure cognitive stance to people, as they do not even consider the possibility that their enemy might be right in some aspects, as truth cannot be different from the opposite of non-truth (lies, mistakes).
The third pattern has included the items concerning loneliness, anxiety and the way out of it.
Table 15. „Loneliness” principal component
|
Communality |
Factor loading |
|
|
Fundamentally, the world we live in is a pretty lonesome place. |
0.42 |
0.65 |
|
In this complicated world of ours the only way we can know what’s going on is to rely on leaders and experts who can be trusted. |
0.43 |
0.66 |
|
Man on his own is helpless and miserable creature. |
0.52 |
0.72 |
|
It is by returning to our glorious and forgotten past that real social progress can be achieved. |
0.35 |
0.59 |
|
Explained variance: 42.92 % |
||
Hungarian troubles
At some point of the questionnaire we posed three problems. Each of the respondents had to decide whether the problems could be considered one of the gravest problems facing the Hungarian society or not. According to the majority’s view all three problems were to be considered as grave and vitally important. There were differences in the proportions. Most of the respondents (73%) considered as grave the problem of the unequal distribution of goods in the contemporary Hungarian society. The decrease of the number of living Hungarians was considered as most important problem by 68%. The smallest proportion of respondents, but still 53% asserted “the mass of unassimilated people” is a graver problem that needs to be solved.
In the case of all three problems we offered four alternatives to resolve them. These alternatives differed from one another in the sense that some of them were radical ones, known from the arsenal of extremist political movements, and there were some, which came from the arsenal of national paternalism and liberalism. Respondents could decide which alternatives they favor most. It was possible to vote for more than one alternative.
Table 16 demonstrates the proportion of those respondents in case of each problem who have chosen the given alternative as a solution for the problem concerned.
Table 16. Solutions of the gravest problems in Hungary (%)
|
Problem |
Solutions |
|||
|
unequal distribution of goods |
Nationalization |
Taxation of profit |
Housing guaranteed by the state |
Income guaranteed by the state |
|
|
24 |
57 |
46 |
65 |
|
loss of population |
Ban on abortion |
Liberal immigration policy |
State support of child bearing |
Propaganda of child birth |
|
|
10 |
8 |
81 |
65 |
|
mass of unassimilated people |
Forced emigration |
Forced assimilation |
Education, training |
Welfare |
|
|
21 |
31 |
78 |
21 |
One can see in the table that in the case of the unequal distribution of goods the radical solutions (guaranteed income, taxation of profit) are most widely chosen by the respondents. In case of the decrease of population and of the people not capable of integration into society the role of the state is supported (81%, respectively 78%). In the case of the “mass of unassimilated people” (i.e. Gypsies) the 21 % of the respondents opted for forced emigration and 31 % for forced assimilation.
As a result of multivariate analysis three patterns have emerged.11
The first pattern (state solutions) included national state policy supporting child birth, state-guaranteed housing and the approval of guaranteed income by the state.
Table 17. Principal component of the ”state solutions”
|
|
Discrimination value |
Centroid Coordinates |
|
|
Not chosen |
Chosen |
||
|
Decrease of population: State support of child bearing. |
0.45 |
-1.49 |
0.3 |
|
Decrease of population: propaganda of child birth. |
0.42 |
-0,97 |
0.44 |
|
The unequal distribution of goods: housing guaranteed by the state. |
0.44 |
-0.65 |
0.7 |
|
The unequal distribution of goods: Income guaranteed by the state. |
0.5 |
-1.04 |
0.51 |
|
The eigenvalue of the dimension: 1.81 (45 %) |
|||
The second pattern (radical solutions) included ban on abortion, expulsion an nationalization.
Table 18. Principal component of the “radical solutions”
|
|
Discrimination value |
Centroid Coordinates |
|
|
Not chosen |
Chosen |
||
|
Reduction of population: ban on abortion. |
0.51 |
-0.25 |
2.07 |
|
Mass of unassimilated people: forced emigration. |
0.45 |
-0,37 |
1.3 |
|
The unequal distribution of goods: nationalization. |
0.5 |
-0.435 |
1.22 |
|
The eigenvalue of the dimension: 1.41 (47 %) |
|||
The third pattern (laissez-faire) included the solutions referring to the approval of liberal immigration policy, to education and training, as well as to aid and support.
Table 19. Principal component of the “Laissez-faire solutions”
|
|
Discrimination value |
Centroid Coordinates |
|
|
Not chosen |
Chosen |
||
|
Reduction of population: liberal immigration policy |
0.33 |
-0.19 |
1.9 |
|
Mass of unassimilated people: education, training. |
0.29 |
-1.11 |
0.27 |
|
Mass of unassimilated people: welfare. |
0.65 |
-0.43 |
1.54 |
|
The eigenvalue of the dimension: 1.25 (42 %) |
|||
The cognitive determining factors of social dominance
In the next part of the paper we try to examine the way the ethnic and class based social dominance is embedded into the order of the variables developed through the discovery of the symptoms of old and new authoritarianism. We applied the method of linear regression analysis, and the results showed that the ethnic social dominance was determined by six variants, which also played a role in authoritarianism.
Table 20. The cognitive determining factors of the ethnic social dominance12
|
R²= 0,42 |
standardized β coefficient |
T test (sig.) |
|
Anomic profit making (pc) |
-0.067 |
0.025 |
|
State solutions (pc) |
-0.068 |
0.02 |
|
Radical solutions (pc) |
0.075 |
0.009 |
|
“Romantic” (dogmatism pc) |
0.465 |
0.000 |
|
„Closed mind” (dogmatism pc) |
0.093 |
0.003 |
|
„Loneliness” (dogmatism pc) |
0.156 |
0.000 |
The strongest determining factor could be identified in the case of dogmatism. The mechanism to accept ethnic based inequality can be expected from those who can be characterized by close mind: they interpret the world based on romantic-heroic terms, their thinking is closed to counterarguments, and they feel lonely. The idea of solving the social problems with the help of the state is against the tastes of these people, they rather choose radical measures. The people accepting ethnicity-based inequalities – keeping every other cognitive characteristic under control – name anomic profit making as the main pressing issues in society. In their opinion the solving of these problems can be done through radical measures.
The model is valid the other way around as well. The refusal of ethnic social inequalities can be expected of people who consider themselves self-made men, they lack romantic heroic thinking, their mind is open, they do not feel lonely on Earth, and they expect the state to resolve social problems.
Class based social inequalities however, were to be explained only by three variables of classic dogmatism and the variable of approval of state intervention in solving the gravest social problems.
Table 21. The cognitive determining factors of the class social dominance13
|
R²= 0,09 |
standardized β coefficient |
T test (sig.) |
|
„Romantic” (dogmatism pc) |
0.251 |
0.000 |
|
„Closed mind” (dogmatism pc) |
-0.171 |
0.000 |
|
„Loneliness” (dogmatism pc) |
-0.118 |
0.003 |
|
State solutions |
-0.152 |
0.000 |
The ones who accept the difference between people based on class dominance see the world from the point of view of romantic, heroic dogmatism, still their mind is not closed, and they do not feel themselves lonely on the planet Earth. Nevertheless they refuse the intervention of the state into the solving of the most ardent social problems.
The ones who do not take for granted the difference between people based on class dominance do not see heroes and “great” people, and do not want to become like them. Still their mind is not open, and they feel lonely in the world. As social democrats they prefer the intervention of the state in the solution of the grave social problems.
The social determining factors of social dominance
The thought patterns legitimizing ethnic and class based inequality between people are not very complex from the point of view of sociological determination. The regression analysis has indicated the explanation value of only three sociological variables in both cases. The size of the settlement has a significant effect on the class or social dominance orientation. The more inhabitants of a settlement, the more likely for both of the variants of social dominance orientation to appear. And the other way around: the smaller the settlement, the lesser the social dominance orientation of the respondent.
Table 22. The sociological determining factors of social dominance14
|
|
Ethnicity based social dominance |
Classed based social dominance |
||
|
|
Standardized β coefficient |
T test (sig.) |
Standardized β coefficient |
T test (sig.) |
|
Type of settlement15 |
0.275 |
0.000 |
0.165 |
0.000 |
|
Level of education16 |
-0.061 |
0.058 |
0.112 |
0.001 |
|
Male / Female |
0.122 |
0.000 |
0.098 |
0.002 |
|
Age |
- |
- |
- |
- |
|
Property |
- |
- |
- |
- |
|
R² |
0.08 |
|
0.06 |
|
If we compare the results presented in table 22 with the ones included in tables 20 and 21, we can observe that the explaining power of the sociological models is much weaker than that of the cognitive models. This indicates that the acceptance or dismissal of social dominance can be traced back not to sociological but to cognitive reasons.
Table 22 demonstrates other interesting facts. On the one hand it shows that although the impact of the type of settlement is positive in both the class and ethnicity based social dominance, meaning that the more urban settlement the respondent lives in, the more he or she accepts the inequality between groups, still, in the case of ethnicity based inequalities this is much stronger than in the case of class based inequalities. Another phenomenon that needs to be explained is that the acceptance of ethnicity based dominance between groups relates oppositely to education: the higher the respondent’s educational level, the more he or she supports equality between groups.17 The acceptance of class based social dominance relates to education in a direct way. This means that the higher the educational level of the respondent, the more expectable it is that he or she will support class based inequalities.
It also needs to be explained why there is an inverse relation between the size of the settlement and the legitimization of ethnic or class based inequalities.
In our opinion this relation is inverse because meeting people in an urban-type environment is impersonal. These meetings typically do not make possible personal acquaintances. The only means of person perception is the application of group categories to the other, which can be ethnic or class based, depending on the stimulus-patterns one persona sees the other. In smaller settlements everyone knows everyone. Instead of group categories personal characteristics are important in information processing dealing with the other persons. People meet as Mr and Mrs Smith, and not “Hungarian” or “Gipsy” or “unemployed”, “clerk”, “manager”, etc.
Social dominance characterized men much more than women. Women, if they can, avoid social dominance orientation, regardless of its ethnic or class based nature. The differences between the two sexes refer to the fact that authoritarianism is not at all new. Men have a problem getting over the sense of superiority which is implied traditionally in the male role, which influences the acceptance both ethnic and class based inequalities.
The cognitive and sociological determining factor of social dominance
Cognitive and sociological elements can be separated from one another only artificially. The aim of this present paper was not the discovery of the relations and causality between these two phenomena, but we need to connect them.
The following table presents the common effects of the previously introduced cognitive and sociological factors on the acceptance or dismissal of social dominance.
Table 23. The common effects of the cognitive and sociological determining factors on social dominance18
|
|
Ethnic based social dominance |
Class based social dominance |
||
|
|
Standardized β coefficient |
T test (sig.) |
Standardized β coefficient |
T test (sig.) |
|
Type of settlement |
0.123 |
0.000 |
0.173 |
0.000 |
|
Level of education |
- |
- |
0.088 |
0.013 |
|
Male / Female |
0.09 |
0.002 |
- |
- |
|
External – internal control |
-0.059 |
0.031 |
- |
- |
|
State solutions |
-0.072 |
0.011 |
-0.172 |
0.000 |
|
Radical solutions |
0.073 |
0.009 |
0.068 |
0.049 |
|
„Romantic” (dogmatism pc) |
0.45 |
0.000 |
0.187 |
0.000 |
|
„Closed mind” (dogmatism pc) |
0.084 |
0.006 |
-0.161 |
0.000 |
|
„Loneliness” (dogmatism pc) |
0.149 |
0.000 |
-0.125 |
0.000 |
|
R² |
0.43 (43%) |
0.14 (14%) |
||
Taking the cognitive and sociological determining factors together19, the weights of the different factors are modified. The type of settlement still shows a relatively strong, positive relation to the acceptance of intergroup dominance: that is the smaller the settlement one lives in, the more possible to dismiss inequality between people in terms of categories. As it was expected in the purely sociological model, the effect of education disappeared from the determining factors of ethnic social dominance, when taking cognitive and sociological factors together. However it was replaced by external – internal control. This means that the more someone interprets his or her fate as a result of external forces, the more he or she is inclined to legitimatize the inequalities between people on an ethnical ground. Approving ethnic based social dominance and the Rokeach-type dogmatism show a relatively powerful, same direction relation. One also needs to observe the role of the respondents’ sex in the ethnic and class based social dominance models. In the case of the former it is typical for men, and less typical for women to accept ethnic inequalities between people. In the case of class based social dominance the effect of the sex factor disappears. Based on this result we may get closer to the interpretation of the debate that can be read in British Journal of Social Psychology 2003/2 (for example the assertion of Wilson and Liu, in which they suggest the tinting of the effects of gender identity on accepting social dominance as opposed to Sidanius and Pratto’s strong allegation). Based on our data we can see that while social gender is a determining factor in accepting or dismissing ethic based social dominance, this is not the case for the dismissal of social dominance.
Socialization effects
If we want to reveal the socialization origin of authoritarianism based on the acceptance or dismissal of the two types of social dominance we can differentiate two groups: the group of people who do not dismiss at least one type of social inequality, and the group of people, who – based on both types – choose inequality between people. The size of the first group exceeded the size of the second in our sample: 60% vs. 40%. According to our assumption the reason why a respondent became part of a particular group, i.e. accepts or dismisses some kind of inequality is not independent of childhood experiences. In order to analyze the socialization pattern we asked the following question: “During your childhood what was the way important decisions were made in your family?” The majority of the representative sample (58%) stated that the mother and father made decisions together. 22% of the respondents said that the mother alone, while 14% stated that the father alone made the important decisions in the family. If we compare the different decisional patterns with the sets of responses concerning the different forms of inequality between groups of people, we can see that among respondents who refuse any type of inequalities between groups of people there are much more ones whose parents made decisions together regarding important family issues (64%), as opposed with those respondents who accept at least one form of inequality between groups of people (55%). This result indicates that there is a connection between social dominance orientation and the way family has been organized.
The paper yields evidence that ethnic and class based types of social dominance orientation are different. Although there are common areas of the two patterns regarding the acceptance or refusal of inequalities between groups of people, we cannot consider these two orientations identical.
Bibliography:
Csepeli, Gy., Prazsák, G. 2010. Örök visszatérés? Társadalom az információs korban. (Eternal return? Society in the Information Age) Budapest: Jószöveg
Gellner, E. 1983. Nations and nationalism. Ithaca: Cornell University Press
Kendall, P., Lazarsfeld, P. F. 1950. Problems of Survey Analysis. In Merton, R. K., Lazarsfeld, P. F. (ed.) Continuities in Social Research: Studies in the Scope and Method of „The American Soldier”. New York: Free Press
Kroger, J. 2007. Identity Development. Adolescence Through Adulthood. California: Sage Publications
Lelkes, O. 2009. Attitudes to inequality. In Tóth, I. Gy. (ed.) TÁRKI European Social Report 2009. Budapest: TÁRKI
Rokeach, M. 1960. The Open and Closed Mind. New York: Basic Books
Rotter, J. B. 1990. Internal Versus External Control of Reinforcement. American Psychologist Vol. 45. No. 4.
Sidanius, J., Pratto, F. [1999] 2001. Social dominance: an intergroup theory of social hierarchy and oppression. New York: Cambridge University Press
Wilson, M. S., Liu, J. H. 2003. Social dominance orientation and gender: The moderating role of gender identity. The British Journal of Social Psychology Vol. 42. No. 2.
DEREX Index: http://www.riskandforecast.com/post/in-depth-analysis/back-by-popular-demand_411.html
1 The sample represented the total population of adult Hungarian citizens living in Hungary. A total of 1010 people were randomly selected into the sample, and they were personally interviewed by the associates of the Marketing Centrum. The constitution of the sample has been adjusted with a four dimensional weight (education, sex, type of settlement, age) to the studied population. As a result of weighing the sample was reduced to 1003 elements.
2 Besides the authors of this study, Dr István Murányi and Dr Zoltán Vági took part in the survey.
3 http://www.riskandforecast.com/post/in-depth-analysis/back-by-popular-demand_411.html (accessed on: April 9, 2011)
4 1: I totally disagree; 5: I totally agree.
5Averages: the higher the average, the higher the level of agreement.
6 In the case of the comparison of the samples of UCLA and two Israeli universities consisting of 7-800 respondents two dimensions were differentiated
7 We did not want either to verify or to falsify the test developed by Sidanius and Pratto: we wanted to measure social dominance in today’s Hungary in order to understand the mechanisms of authoritarianism and social exclusion. As a first step we analyzed the 11 questions with maximum likelihood (rotated) factor analysis in order to find as much of the non a priori attitude patters in the answers as possible. We differentiated two factors, but they did not match perfectly. As a result of this we conducted separate principal component analyses on the two groups of variables. The two main components gave very good indexes (table 3 and 4), only one question was omitted from the analysis: “Sometimes other groups must be kept in their place.”
8 As one can observe, the two primary components are in an opposite relation, which means that in the case of one the high factor scores refer to the acceptance of the increase of inequality, while in case of the other the refusal of inequality. In order for the two components to head the same direction, we “rotated” the principal component measuring class based social dominance orientation, and in the case of both primary components the ones accepting inequality received high factor scores, while the ones refusing it, low factor scores.
9 19 respondents, i.e. 1.8% of the sample could not be included in any of these as a result of the fact that they did not answer to a high number of questions.
10 The SPSS package makes it possible to perform a “principal component analysis” in the case of the categorical variables. Version 18 of the package includes this analysis in the data reduction block, the optimal scaling menu. The first step of the method is to transform the categorical variables into a numeric variables, i.e. it quantifies it (using alternating least square), and then the main components are prepared, which can be interpreted as the scores of discriminating functions.
11 We applied the method described in footnote 10.
12 F test sig. <0.000
13 F test sig. <0.000.
14 F test sig. <0.000.
15 We measured the type of settlement on a 5 degree scale, where 1 indicates people living on farms, while 5 indicates people living in the capital.
16 We measured education on a 5 degree scale as well, where 1 indicates unfinished elementary education, while 5 referred to university or college degree.
17 Although the level of significance of the T-test exceeds the level usually applied one with 0.008., we considered it important and of a great significance to emphasize this phenomenon, that is why we included it in the model.
18 F test sig. <0.000.
19 That is based on the Lazarsfeld paradigm the different independent variables and the effects of their interaction are analyzed together (Kendall, Lazarsfeld 1950).
Keresés

Tananyag ajánló
Polgárháború Jugoszláviában
150 ezer halott, félmillió sebesült, 4 millió menekült és mintegy 100 milliárd dolláros kár. Népirtás, etnikai tisztogatás, koncentrációs táborok, háborús bűnösök, nemi erőszak. Az 1991-1999 közötti polgárháborúban az egységes jugoszláv állam nyolc részre szakadt. A második világháború óta ez volt az európai történelem legnagyobb és legsúlyosabb háborúja.
Támogatók
A Társadalominformatika: moduláris tananyagok, interdiszciplináris tartalom- és tudásmenedzsment rendszerek fejlesztése az Európai Unió támogatásával, az Európai Szociális Alap társfinanszírozásával, az ELTE TÁMOP 4.1.2.A/1-11/1-2011-0056 projekt keretében valósul meg.

![]()
![]()
![]()